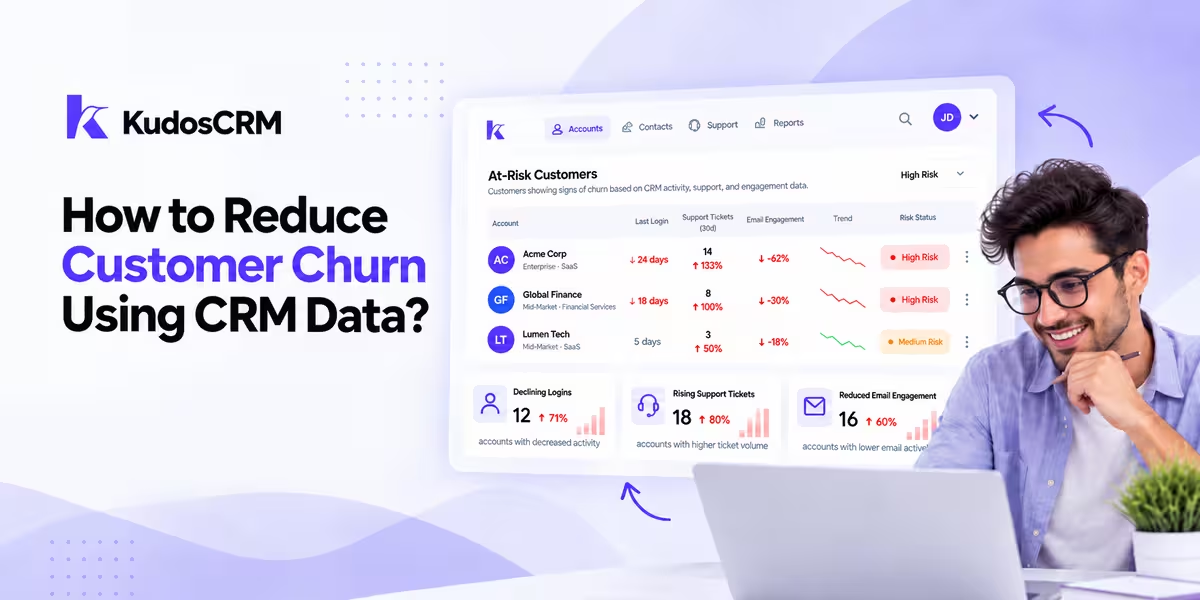

The fastest way to reduce customer churn is to recognize the warning signs before customers decide to leave. Declining product usage, unresolved support tickets, and reduced engagement can signal potential dissatisfaction long before a renewal conversation. Your CRM helps bring these signals together, allowing customer success managers to identify at-risk accounts, investigate problems, and take action before customers cancel.
This guide explains which CRM fields to monitor, how to establish practical churn-risk thresholds, and how to create retention workflows. It focuses on customer success teams managing multiple accounts and provides illustrative examples you can adapt to your business. For a broader framework covering onboarding, customer health, and renewals, read our customer success program guide.
Why CRM Data Catches Churn Weeks Before a Customer Complains
Surveys tell you what a customer is willing to say. Customer behavior adds another perspective. An account may provide positive survey feedback while showing declining product engagement. Monitoring login frequency, feature adoption, and support interactions helps customer success teams identify potential problems that customer surveys alone might miss.
The period between declining engagement and cancellation creates an opportunity to intervene. By monitoring changes in customer activity over time, teams can identify unusual patterns and investigate the reasons behind them. However, the warning period varies by product, contract length, and customer behavior. The goal is to identify meaningful changes early enough to take appropriate action.
The Four CRM Data Categories That Predict Churn
Treat these as a diagnostic framework, not a checklist. Four useful categories of customer data are product engagement, support activity, customer communication, and commercial information. Their importance varies depending on your business model and the data available in your CRM.
Product engagement reveals how customers use your product over time. Monitor login frequency, active users, feature adoption, and changes in usage patterns. Compare each account's activity with its previous behavior rather than applying identical thresholds to every customer. Product usage information must be connected to your CRM if your software does not record it natively.
Support data helps identify unresolved customer problems. Monitor ticket frequency, unresolved issues, escalations, and missed service-level agreements. A sudden increase in support requests can indicate friction, although it can also reflect active product adoption. Compare ticket patterns with the customer's usual activity and investigate unresolved issues before treating them as evidence of churn.
Communication data reveals changes in customer relationships. Monitor email replies, missed meetings, declining response rates, and reduced engagement with key contacts. Email opens can provide additional context, but they should not be your primary warning signal because privacy features can affect tracking accuracy. Combine communication trends with product usage and support information before escalating an account.
Commercial signals provide additional information about potential customer churn. Monitor overdue payments, downgrade requests, approaching renewals, and changes in key decision-makers. An explicit cancellation or downgrade request deserves immediate attention, while an overdue invoice or inactive contact requires further investigation. Connect relevant billing and account information to your CRM when these records are maintained in separate systems.
How to Connect Product Usage and Billing Data to Your CRM
Before building churn alerts, make sure your CRM has access to the required information. Product analytics, support systems, and billing platforms often store customer information separately. Connecting these records gives your customer success team a clearer view of potential churn risks.
Start by mapping the following information to each customer account:
Product activity: Last login, active users, and feature adoption.
Support history: Unresolved tickets, issue severity, and SLA breaches.
Commercial information: Renewal dates, payment status, and downgrade requests.
Use integrations, supported webhooks, or scheduled imports where appropriate. Match records using consistent customer identifiers and check that each field updates regularly. Treat field names such as last_login_date as illustrative unless they match your actual CRM configuration.
Before enabling alerts, test the data using several customer accounts. Missing or outdated records should be marked as unknown rather than automatically classified as churn risks.
Set Your Churn Rate Baseline Before You Build Anything
Measure your churn rate before implementing retention workflows. Customer churn rate equals the number of customers lost during a period divided by the number of customers at the start of that period, multiplied by 100. Gross revenue churn measures recurring revenue lost through cancellations and downgrades, divided by recurring revenue at the beginning of the period. Calculate monthly and annual churn separately using consistent measurement periods.
Compare your churn rate with businesses serving similar customer segments. Industry benchmarks provide useful context, but churn varies by company size, billing model, contract length, and customer value. Use a relevant external benchmark alongside your historical performance rather than treating one industry average as a universal retention target. Separate customer churn from revenue churn when making comparisons.
A simple calculation shows the financial impact of improving retention. Suppose a SaaS business starts the year with $2 million in ARR and reduces annual gross revenue churn from 10% to 8%. The two-percentage-point improvement represents $40,000 in additional recurring revenue retained from that starting base, before accounting for other changes. The actual financial benefit depends on your customer mix and revenue movements. Retention also matters because acquiring replacement customers can be expensive. Harvard Business Review reported in 2014 that, depending on the study and industry, acquiring customers could cost five to 25 times as much as retaining them.
Build a Churn-Risk Segment With Thresholds You Can Act On
A single warning signal does not always indicate that a customer plans to leave. For example, 14 days without a login might be unusual for an account that normally uses your product daily but perfectly normal for one that logs in monthly. Compare each account's behavior with its historical activity and use signals from different categories to identify potential risks. Treat explicit cancellation requests as exceptions that require immediate attention.
The following table provides illustrative warning signs you can adapt to your customers' normal behavior.
Risk tier | Product engagement | Support | Communication | Commercial |
|---|---|---|---|---|
Low | Usage remains near its historical baseline | No unusual unresolved issues | Regular replies and meetings | Payments and renewals remain on track |
Medium | Sustained decline in usage | Ticket volume rises or issues remain unresolved | Response times increase | Payment or renewal concerns emerge |
High-risk indicators | Extended inactivity for a normally active account | Multiple significant unresolved issues | Key decision-maker becomes unreachable | Confirmed cancellation or downgrade request |
For an illustrative high-risk rule, flag an account when it has no product activity for 14 days despite normally using the product every week AND has two significant unresolved support tickets. Review the account before confirming its risk level. An explicit cancellation request should trigger immediate investigation even without a second signal. Overdue payments and contact changes should prompt follow-up rather than automatically classifying a customer as high-risk.
This is where the approach parts ways with a full customer health score. A health score compresses everything into one number for at-a-glance monitoring. A risk segment does the opposite: it keeps the raw fields visible, so the triggering condition itself tells the CSM what to do.
Automate Early-Warning Alerts So No At-Risk Account Slips
Once the necessary customer data is available, configure an example workflow using these conditions. If your CRM does not support the combined trigger, start with a regularly updated risk report or saved view.
Data requirements: Product activity and support-ticket information must be accurately associated with the same customer account.
Trigger: No product activity for 14 days AND at least two significant unresolved support tickets, assuming this differs from the customer's normal usage.
Owner: Assign the alert to the account's designated customer success manager.
Response: Create a follow-up task for review within two business days. Escalate priority accounts to a manager when appropriate.
Every risk alert needs a clear owner and a defined response time. Route alerts to the customer success manager responsible for the account and use a daily summary or prioritized task list to avoid unnecessary notifications. KudosCRM's workflow automation supports scheduled workflows, conditional logic, and task creation. However, confirm whether the required product-usage integrations and combined churn triggers are available in your workspace before implementing this example.
Run Tiered Playbooks to Reduce Customer Churn Before Accounts Go Dark
Not every red flag deserves the same response, and matching effort to tier is where you cut churn without burning out the team.
High-risk accounts need a prompt, personalized response. The assigned CSM should investigate the warning signals and contact the customer within two business days using an appropriate channel. If an important stakeholder has left, review the company's key customer contacts and consider introducing a new executive sponsor. An August 2026 ChurnZero case study reported that one SaaS company initially attributed 31% of its churned revenue to leadership changes and later reduced that figure to 8% after improving sponsor monitoring and introductions. The results illustrate one company's experience rather than a guaranteed outcome.
Medium-risk accounts scale differently. Calling 80 of them one by one is not a strategy. Use a scalable check-in workflow that includes personalized messages, relevant feature guidance, and invitations to short re-onboarding sessions. Create follow-up tasks for accounts that remain disengaged or report unresolved problems, and prioritize personal outreach based on account value and the seriousness of the warning signals.
Low-risk accounts need a light nurture touch and nothing more. Continue regular engagement and periodic account reviews while reserving more intensive interventions for customers showing meaningful warning signs.
Measure Whether Your Churn Prevention Model Works
Measure both how accurately your risk rules identify potential churn and how effectively your team responds to flagged accounts. Evaluate prediction performance using historical data where possible, then track alert coverage, response time, and customer retention after intervention. These measurements help distinguish problems with the warning system from problems with the retention process.
Risk-tier precision measures how many accounts classified as high-risk actually churned in a historical validation dataset. Alert coverage measures the percentage of flagged accounts reviewed within the required timeframe. Track the subsequent retention rate of customers who receive intervention, but interpret it carefully: an account that renews after receiving help may have been correctly flagged. Where possible, compare retention against similar accounts or historical cohorts rather than attributing every renewal to the intervention.
Review your risk thresholds after each meaningful renewal cohort. Compare historical risk classifications with actual customer outcomes and investigate accounts that churned despite showing few warning signs. Also review alerts that required no intervention to identify possible false positives. Adjust your thresholds based on consistent patterns rather than individual cases. Reassess the results periodically as your product, customer behavior, and retention processes change.
CRM Data Mistakes That Inflate Risk Scores and Waste CSM Time
Three habits quietly wreck otherwise good models.
Relying too heavily on customer satisfaction surveys while ignoring behavioral data can produce misleading results. An account may report positive feedback but gradually reduce its product usage. Evaluate survey responses alongside feature adoption, engagement trends, and the customer's actual business outcomes. No single metric reliably explains every customer's likelihood of leaving.
The second mistake is treating every churned account identically in the post-mortem. Different cancellation reasons require different responses. Pricing concerns may call for a commercial review, while poor adoption may indicate a need for better onboarding or training. Record the customer's confirmed cancellation reason and examine recurring patterns before changing your retention strategy.
Ignoring commercial information can leave gaps in your churn prevention strategy. Payment problems, downgrade requests, contract changes, and the departure of important stakeholders provide context that product usage alone cannot capture. Connect these records to your CRM where appropriate and review them alongside engagement and support information.