
Your team expects a new CRM to help close more deals. Finance needs to know how many of those deals would have closed anyway, what the rollout will cost, and when the extra cash will arrive. Those answers can change whether the project fits this year’s budget.
Build your CRM ROI assumptions from a sales baseline, itemized costs, and a realistic collection schedule. A worked example for a 10-rep team shows how to compare three scenarios and calculate when the investment pays back.
How Do You Calculate First-Year CRM ROI?
First-year CRM ROI is the net financial gain from the CRM divided by its first-year cost, expressed as a percentage. Count the benefits and costs that change compared with continuing your current process, and measure them over the same period.
CRM ROI (%) = (First-year financial benefits − First-year CRM costs) ÷ First-year CRM costs × 100
For a cash-based budget, financial benefits include cash collected from additional sales after direct variable costs, plus any independently verified cash savings. The CRM ROI formula shows how much value remains after paying for the project. Payback shows when cumulative cash benefits cover what you’ve spent.
Which Assumptions Belong in a CRM ROI Forecast?
Build your CRM ROI forecast from the results your team gets today. A closed-deal report can establish your current win rate, and a pilot can help estimate the lift from a workflow change. Label the inputs you’re still testing as scenario assumptions.
Use a Comparable Sales Baseline
Calculate your baseline win rate by dividing closed-won deals by all closed decisions, including losses. Use the same period and deal type for the number of opportunities, win rate, and average won deal value. For example, compare new-business deals in the same segment so a change in the mix of renewals or larger accounts stays visible.
Estimate the Contribution From Additional Wins
Multiply the number of opportunities expected to reach a decision by the win-rate lift as a decimal. A two-point lift is 0.02. Multiply the additional expected wins by the average deal value and your contribution margin, which is the share of sales left after variable costs such as delivery and commissions.
Sales-cycle length is one input in sales velocity. If a shorter cycle brings the same receipts forward, reflect the earlier payment dates in your cash-flow schedule.
Account for Rollout and Collection Time
Plan when the team will start using the new process, when those deals may close, and when customers typically pay. Faster follow-up may show up in activity reports weeks before customers sign or pay. Use your CRM implementation timeline and billing terms to estimate when benefits can begin.
Separate Staff Time From Cash Savings
Record saved hours as available capacity when the team uses them to generate the extra wins already in the forecast. Add separate cash savings when payments actually fall, such as lower overtime or a canceled software subscription. Record each benefit once across the model.
Time savings can still be worth measuring. In a January 2024 report examining 11 CRM case-study calculations from 2023, Nucleus Research attributed 51% of measured ROI to time saved through productivity and process improvements. Use your own task timings to estimate how much time your team can reclaim.
What Does the CRM Rollout Cost in Year One?
List the one-time and recurring costs of owning the CRM, including setup, migration, training, licenses, integrations, and support. Use incremental payments in the cash forecast. Track internal staff time separately if it affects your broader CRM total cost of ownership without changing payroll. If a cost is uncertain, record the estimate and who can confirm it.
Suppose a 10-rep team pays $18,000 upfront and $1,000 a month for subscriptions and support. These are illustrative US dollar amounts. The model includes the upfront payment and 12 monthly payments.
Cost | When it’s paid | First-year cost |
|---|---|---|
Configuration and deployment | Upfront | $8,000 |
Data cleanup and migration | Upfront | $4,000 |
Paid onboarding and training | Upfront | $3,000 |
Integration setup | Upfront | $3,000 |
CRM licenses | 10 seats × $70 per month × 12 months | $8,400 |
Connector fees and support | $300 per month × 12 months | $3,600 |
Total first-year CRM costs | $30,000 | |
How Do Three CRM ROI Scenarios Compare?
Use one sales baseline and change an assumption across scenarios to see how much it matters. In this example, the team has 100 comparable opportunities reaching a decision per year, a 25% baseline win rate, and an $80,000 average won deal. Only the assumed win-rate improvement changes across the three cases.
Contribution margin: The team keeps 50% of incremental sales after variable costs.
First-year cash realization: The team expects to realize 50% of the annual contribution it could generate once the new process is fully in use. This reflects rollout, deal timing, and collections.
First-year CRM cost: The same $30,000 applies to each scenario. The model uses pre-tax cash flows and counts contribution from additional deals as its benefit.
Illustrative CRM ROI scenarios with the same sales and cost baseline
Input or result | Downside | Base | Upside |
|---|---|---|---|
Win-rate increase | +1 point | +2 points | +3 points |
Win rate once fully in use | 26% | 27% | 28% |
Additional expected annual wins once fully in use | 1 | 2 | 3 |
Additional annual booked sales once fully in use | $80,000 | $160,000 | $240,000 |
First-year cash contribution | $20,000 | $40,000 | $60,000 |
First-year net gain or loss | −$10,000 | $10,000 | $30,000 |
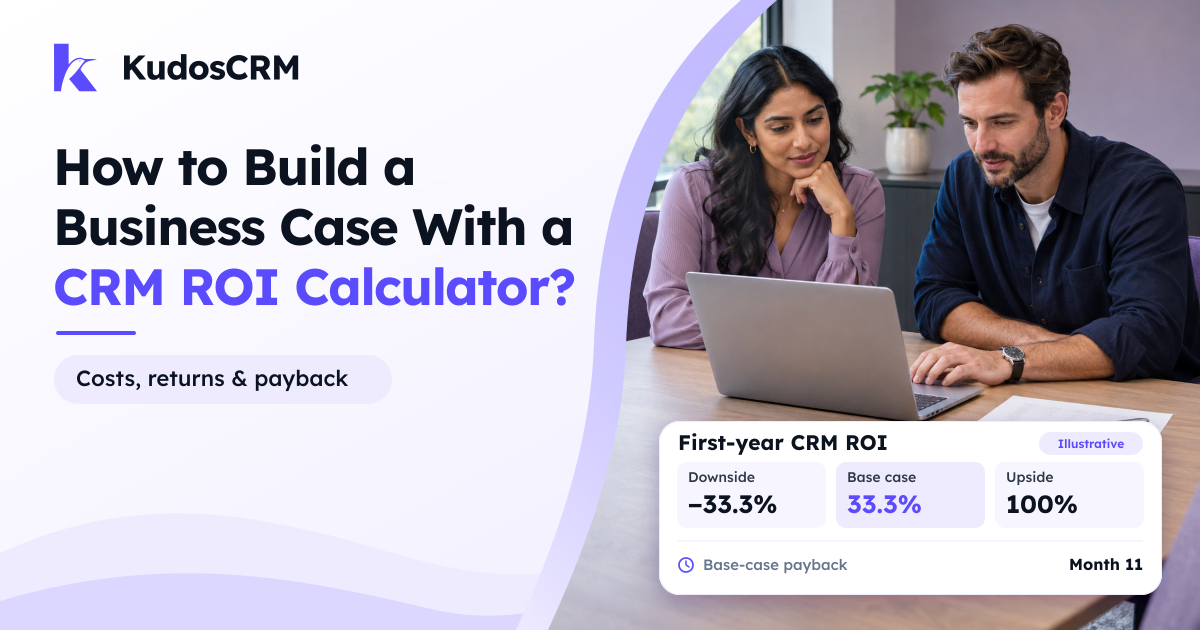
First-year CRM ROI | −33.3% | 33.3% | 100% |
Moving from 25% to 27% adds two percentage points, equivalent to an 8% relative increase. At 100 opportunities, that gives two additional expected wins once the CRM changes take full effect. Multiply 2 × $80,000 × 50% contribution margin × 50% first-year cash realization to get $40,000 in first-year cash contribution.
Under these inputs, every extra win-rate point adds $20,000 to first-year cash contribution. Covering the $30,000 cost by year-end requires a lift of 1.5 percentage points, from 25% to 26.5%. If your team expects a smaller lift, check whether it has a separate cash saving that can cover the gap.
How Do You Calculate the CRM Payback Period?
List incremental cash benefits and CRM payments by month. Subtract the month’s costs from its benefits, then add that net cash flow to the previous month’s balance. The CRM payback period ends in the first month when that running balance reaches zero or turns positive.
The base case below starts with the $18,000 setup payment before month one. Cash benefits begin in month four and rise as additional deals close and customers pay. The schedule distributes the base case’s $40,000 across the year, with $1,000 in recurring CRM costs each month.
Base-case monthly cash flow in USD, before tax and without discounting
Month | Cash benefit | CRM cash cost | Net cash flow | Cumulative cash flow |
|---|---|---|---|---|
0 · Upfront | $0 | $18,000 | −$18,000 | −$18,000 |
1 | $0 | $1,000 | −$1,000 | −$19,000 |
2 | $0 | $1,000 | −$1,000 | −$20,000 |
3 | $0 | $1,000 | −$1,000 | −$21,000 |
4 | $2,000 | $1,000 | $1,000 | −$20,000 |
5 | $2,000 | $1,000 | $1,000 | −$19,000 |
6 | $2,000 | $1,000 | $1,000 | −$18,000 |
7 | $4,000 | $1,000 | $3,000 | −$15,000 |
8 | $4,000 | $1,000 | $3,000 | −$12,000 |
9 | $4,000 | $1,000 | $3,000 | −$9,000 |
10 | $7,000 | $1,000 | $6,000 | −$3,000 |
11 · Payback | $7,000 | $1,000 | $6,000 | $3,000 |
12 | $8,000 | $1,000 | $7,000 | $10,000 |
First-year totals | $40,000 | $30,000 | $10,000 | $10,000 |
At the end of month 10, the project still has $3,000 to recover. The $6,000 net cash inflow in month 11 brings the balance to $3,000, so payback falls in month 11. A slower collection schedule could push that month back even if the same cash comes in by year-end.
How Do You Check Your CRM ROI Forecast After Launch?
Give each major assumption an owner, a source, and a review date. Record what changed during rollout, such as pricing, staffing, or lead sources, so you can judge how much of the improvement belongs in the CRM ROI business case.
Win rate and deal value: Compare closed decisions for similar deals before and after launch. Use CRM analytics reports for win rate, average deal size, and cycle length.
Adoption and time saved: Measure a repeatable task before and after rollout, then check how many reps use the new process. Apply your CRM adoption measures to see whether the expected changes are taking hold.
Costs and collections: Compare monthly invoices, cash receipts, and variable costs with the forecast. Update the payback month when payments or benefits move.
Conclusion
Put the first-year cost, base-case ROI, and expected payback month on one page. Show the downside beside the base case and identify the assumptions that would change the budget decision. Finance can then check the numbers against quotes, sales data, and the expected timing of payments.